Saturated Stars
In a typical WFCAM exposure the full dynamic range available before pixel saturation kicks in is around 7 mag above the faint end limit — defined here as the 5σ magnitude limit for point sources. A good, and typical, example of the problems this causes at brighter magnitudes is shown in the colour-magnitude diagram (CMD) in Figure 1, which is taken from full J and K-band tiles centred on the dE galaxy NGC 147, a satellite of M31.
First a small detour. Although the CASU pipeline carries out morphological classification of objects, it deliberately does not extend this to include potentially saturated images. Observant users with access to the calibrated flat file catalogues from the CASU pipeline will have noticed a saturation keyword in the secondary FITS headers attached to each detector. This is determined as part of the classification process and specifies the average saturation level for the detector. Coupled with the object peak flux and local sky background level from the catalogue, this allows a simple test to decide if objects are potentially saturated or not. Since the saturation level varies somewhat over the processed images for each detector, the choice of a suitable threshold, conservative or otherwise, to flag objects as saturated is left as a post-processing choice.
Our own band-merging software uses a slightly conservative 90% of saturation threshold to flag objects as potentially saturated. These objects are highlighted in red in Figure 1 and show the combined effect of saturation in both passbands in a CMD. The obvious curvature in the F/G and K/M star sequences brighter than K=12 and the complete ab- sence of sources brighter than K=10 is entirely due to saturation.
At the recent UKIRT 30th Birthday workshop, Andy Longmore asked if there was any way of recovering the information for bright stars. As it happened the CMD of NGC 147 I had shown at the meeting had already had such a fix applied to it as part of our normal band merging software (temporarily disabled in producing the CMD in Figure 1).
The fix is straightforward. For near-IR detector arrays charge bleeding is not generally an issue and the main effect of saturation is to simply reduce the recorded flux in the central core of the object. By simply ignoring the flux in the central region and effectively integrating up the flux in the outer parts of an object, an unbiased flux estimate can be made. In this case we have available aperture fluxes integrated over a range of radii and it is simply a case of selecting appropriate ones to use. The already available aperture corrections can then be used to figure out what proportion of the total flux lies between any pair of apertures and thence provide a correction to the total flux.
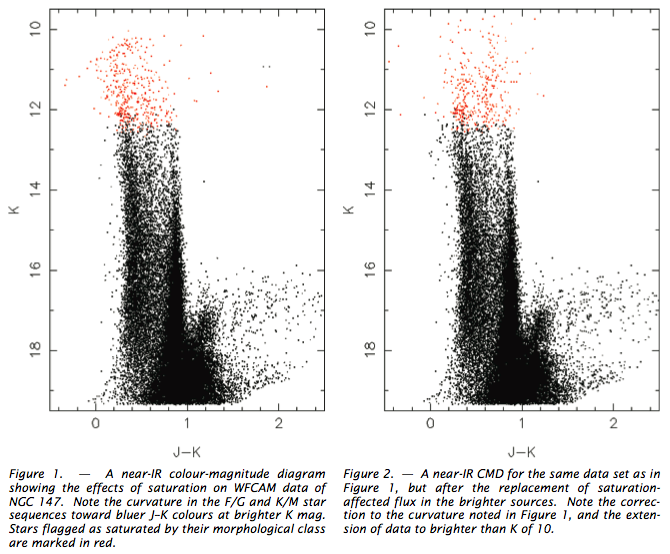
Figure 2 illustrates the normal use of our band-merging software for the same data. Here the flux difference between apertures of diameter 4 arcsec and 2 arcsec has been scaled using the relevant aperture corrections and used to replace the original saturation-affected flux. It does a pretty good job of extending the dynamic range by about 3 magnitudes before itself being clobbered by ever expanding saturated cores.
Why these two apertures and why stop at two? Clearly, a more complex assortment could be used, but the 4 arcsec aperture contains typically 99% of a point source flux and the 2 arcsec aperture typically some 70–75%. This yields both a good signal and a modest correction factor, prerequisites for a stable outcome. By ~10th mag the overlap with 2MASS should be more than enough for most users and certainly in crowded regions ever larger apertures lead to ever-larger likelihoods of other problems with the flux estimates.
Even with optical detectors it is possible to claw back 1–2 mag of dynamic range with a similar approach and, indeed, frustration at not being able to track cluster sequences to brighter magnitudes is what led to this fiddle in the first place.
Finally, please note that the saturation correction described above is currently not applied to merged WFCAM photometry tables available from the WFCAM Science Archive (WSA).
Acknowledgements
Thanks to Andy Longmore for input on this subject.
Original text published in the UKIRT Newsletter #25.