Photometric properties
The VISTA Photometric System
VISTA Photometry is on the VISTA system, tied to (but different from) 2MASS, calibrated via colour equations between the two systems (below). Briefly the following steps are followed to calibrate a single VISTA pawprint.
1. All detectors are normalised to the same approximate gain using the flatfield exposures.
2. The catalogue of sources detected (via imcore) on each VISTA detector is crossmatched against the 2MASS catalogue (this is also used to refine the astrometric solution).
3. The 2MASS magnitudes for all matching stars are converted to expected VISTA magnitudes using the colour equations (below), including terms to account for interstellar reddening.
4. The offset between the median 2MASS and VISTA magnitudes is the Zeropoint of the detector(corrected to airmass unity under the assumption of a default extinction value for the filter)
5. A single preliminary median (of all 16 detectors) Zeropoint is written to the FITS header (keyword: MAGZPT), while the scatter in the measurements (the median absolute deviation MAD*1.48, a robust estimate of the Gaussian sigma) forms a measure in the error in the Zeropoint (keyword: MAGZRR).
6. A final stage to the photometric calibration takes account of systematic differences between the 16 detectors, measured on a monthly basis. The residuals from all 2MASS stars used in the frame zero-point determination (i.e. J, H, Ks signal:noise >10:1) are also computed on a per pointing basis together with their standard coordinate location with respect to the tangent point of the telescope optical axis. The residuals are stacked and used to generate delta-Zeropoints per detector (the value of MAGZPT is actually updated for each detector).
7. At the time of writing, no significant spatial residuals (above the detector-to-detector offsets) are seen (e.g. that could arise from scattered light). More details below.
VISTA-2MASS colour equations
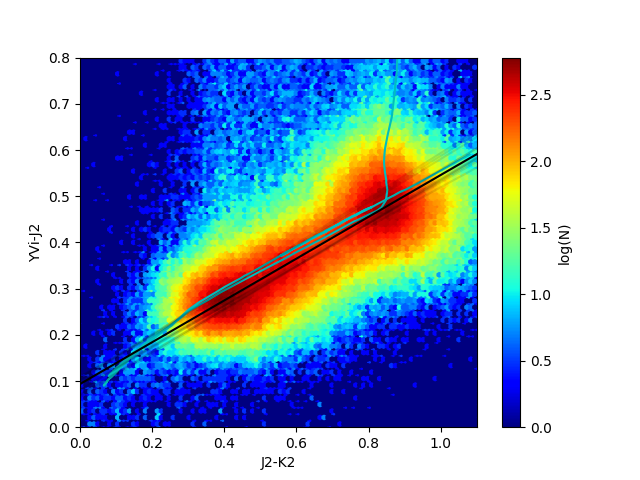
The VISTA system is tied down to 2MASS photometry, as to derive zeropoints we compare our photometry with 2MASS stars in the field that have been transformed into the VISTA photometric system. To do this, we need the colour dependence of the 2MASS to VISTA transformation. As these colour equations are derived comparing off-plane VISTA fields, as more data become available, we can improve these calibrations. We look at diagrams comparing instrumental magnitudes with 2MASS, as a function of 2MASS colour (in this case, the black lines are monthly fits, that give an idea of the dispersion, while cyan is a PARSEC isochrone):
Catalogues labelled with CASUVERS 1.5 or later will incorporate the latest version of these equations, along with zeropoints derived only from (J-K) 2MASS colours, that offer better performances. The colour terms are:
| Filter | Nominal ZP (ADU) | Nominal ZP (e-) | Colour equation |
| Z | 23.95 | 25.51 | +(0.859 +- 0.077)*(J-Ks) |
| Y | 23.50 | 25.06 | +(0.457 +- 0.019)*(J-Ks) |
| J | 23.79 | 25.35 | -(0.031 +- 0.006)*(J-Ks) |
| H | 23.89 | 25.45 | +(0.015 +- 0.005)*(J-Ks) |
| Ks | 23.06 | 24.62 | -(0.006 +- 0.007)*(J-Ks) |
In deriving the photometric zero-point per field we also make a correction for Galactic extinction toward each star used proportional to E(B-V). The initial value is taken directly from the Schlegel et al. 1998 extinction map values, however if this leads to an extinction-corrected (J-Ks) outside the range of 0 to 1 the per star extinction is recomputed to yield the median stellar population colour.. The coefficients used for the correction are: 0.264, 0.103, 0.000, 0.000, 0.005 for Z, Y, J, H, Ks respectively in the sense of increasing the inferred zero-point. The maximum offset is limited to E(B-V) = 10 due to an increasing non-linear dependency in high extinction regions. To compute extinction-corrected magnitudes we use the relevant Schafly et al. 2011 coefficients for Rv=3.1, with small adjustments due to the differences in the effective central wavelengths of the VISTA bands. These are respectively: 1.395, 1.017, 0.705, 0.441, 0.308 for Z, Y, J, H, Ks.
For catalogues labeled with CASUVERS 1.3.* or earlier, we use 2nd pass (improved) colour equations and zeropoints, derived from to 2MASS from a compilation of data measured on good (photometric) nights, with good seeing, and for fields with E(B-V)<0.1. The nominal ZPs are unchanged, but the colour equations have been adjusted slightly to give robust fits to the data. Earlier colour equations are reproduced at the bottom of this page for completeness.
| Filter | Nominal ZP (ADU) | Nominal ZP (e-) | Colour equation |
|---|---|---|---|
| Z | 23.95 | 25.51 | +1.025*(J-H) |
| Y | 23.50 | 25.06 | +0.610*(J-H) |
| J | 23.79 | 25.35 | - 0.077*(J-H) ; -0.065*(J-Ks) |
| H | 23.89 | 25.45 | +0.032*(J-H) |
| Ks | 23.06 | 24.62 | +0.010*(J-Ks) |
| NB118 | 20.92 | 22.48 | +0.100*(J-H) |
| NB980 | 20.95 | 22.51 | +0.680*(J-H) |
ZV = J 2 + 1.025*(J-H)2
YV = J2 + 0.610*(J-H)2
JV = J2 - 0.077*(J-H)2
HV = H2 + 0.032*(J-H)2
KsV = Ks2 + 0.010*(J-Ks)2
In deriving the photometric zero-point per field we also make a correction for Galactic extinction toward each star used proportional to E(B-V)' , the Bonifacio, Monai & Beers (2000) correction to the Schlegel et al. extinction map values i.e.
if E(B-V) > 0.1 then E(B-V) -> 0.1+0.65* [E(B-V) - 0.1]
where E(B-V) is computed using bilinear interpolation from the 4 nearest Schlegel map pixels.
The coefficients used are: 0.37, 0.14, 0.010, 0.015, 0.005 for Z, Y, J, H, Ks respectively in the sense of increasing the inferred zero-point. The maximum offset is currently limited to E'(B-V) = 10 pending further investigations of the dependency in high extinction regions.
VISTA - WFCAM Equations
(updated 30 July 2014)
A signifcant fraction of the sky has been observed repeatedly with both VISTA and WFCAM. This enables a transformation between the VISTA and WFCAM photometric systems to be calculated. The figure below shows the difference between VISTA and WFCAM magnitudes as a function of colour for hundreds of thousands of point sources; the greyscale represents density of point sources. The point sources were selected to have exceptionally high photometric accuracy (see details below). The red line shows a weighted, ordinary least-squares fit to the data after binning objects by colour and rejecting outliers. To avoid adverse selection effects and biases, only data with 0.25 < (J-K) < 0.8 mag are considered in the fit. Note that there is a few percent offset for some filters. The derived transformation (with 1σ uncertainties) between the VISTA (V) and WFCAM (W) systems are:

The uncertainties should be considered systematic; they are the rms of best fit values when fitting over different ranges of J-K colour.
The following criteria were used to select the point sources that appear in the figure:
- airmass < 1.5
- 1 pixel < seeing < 1.25"
- 0.001 < average ellipticity of point sources in the frame < 0.1
- magzrr < 0.07 mag (rms of magzpt across chips)
- nightzrr < 0.09 mag (rms of magzpt across the whole night)
- stdcrms < 0.25" (rms of WCS fit residuals)
- MAD(magzpt) < 0.02 mag (median absolute deviation of magzpt across chips)
- K(WFCAM) < 12 mag (avoid saturated or nearly saturated objects)
- error in K(WFCAM) < 0.025 mag
- E(B-V) < 0.1 mag (avoid highly reddened regions)
Most of these point sources were observed several (up to ~500) times by the same telescope with the same filter. We merged these repeat observations and retained some statistics on how the magnitude varies for individual objects. Finally, we cross-matched objects across filters & telescopes by taking the closest match within 1".

Illumination Corrections
Detected object catalogues for each final product stacked pawprint image were calibrated with respect to 2MASS and the individual photometric residuals recorded. The image processing stage produces an internally consistent gain-corrected set of detector images which means, at least to first order, a single overall zero-point per pointing suffices to calibrate the photometry to an external system. This has the benefit that all suitable 2MASS stars for all 16 detectors for any given pointing product can be used with a consequent sub-% rms error on the derived value. Subsequent calibration steps (e.g. Hodgkin et al. 2009) can then focus on deriving the systematic variations such as individual small differences in detector zero-points and subtle illumination corrections across the focal plane. We illustrate the combined size of both of these systematic effects for J-band data taken during this period. By suitable binning and combining all the photometric residuals for each detector region on the focal plane, any small scale systematics in 2MASS average out and we are left solely with effects due to VISTA and the processing system.
J-band

In this on-sky orientation N is to the top and E to the left with detector#1 top right, detector#4 bottom right and detector#16 bottom left. As can be seen, even without individual detector corrections the overall systematics are generally at the % level apart from the outer part of detector#16 which is known to have some interesting imaging properties. Similar overviews are available for Z, Y, H, Ks and NB118 and will be added to this page later.
Note: that photometric corrections due to the known astrometric distortion effect have already been allowed for during the calibration; and that since VISTA observes at a variety of PAs all data has been "rotated" back to PA = 0 degrees in producing this stacked plot - with more data we need to investigate this at fixed PAs to look for other effects.
After detector-level ZP corrections the illumination correction for the J-band becomes

Similar overviews are available for Z, Y, H, Ks and NB118 and the full set of these plots can be found here.
Monitoring the VISTA Sensitivity
Commissioning data taken during May and June 2009 have been used to derive some photometric properties of VISTA including: average zero-points and their variation over this period; an estimate of the colour equations for each filter
with respect to 2MASS; and a first pass estimate of the illumination corrections in the 6 filters in use during this period.
Variation of measured photometric zeropoints (ADU) in: Z (lightblue), Y (black), J (blue), H (green), Ks (red), passbands over the period 20th May 2009 to 23rd June 2009 (see summary QC pages ..... for further details of individual nights). This includes non-photometric conditions such as occurred in the middle of this period.

Photometric ZP long-term variation
The following figure shows the variation of the zero point from the start of the science verification and dry run observations to March 2011 (note that the primary mirror was recoated in September 2009).

After the mirror coating intervention in April 2011 the zero points are:


VISTA throughput
From the Bohlin 2007 Vega spectrum it is possible to work out how many photons will be incident on the VISTA collecting area after modifying for atmospheric transmission and assuming the effective collecting area is PI*(3.7/2)^2- PI*(1.63/2)^2. For this initial exercise approximations to the filter transmission, detector sensitivity and mirror reflectivity, and glass transmission were used (these will be updated shortly since all the information is to hand).
The measured ZPs in a Vega system were converted to photons for a star with ZYJHK=0, (assuming the ZP is equivalent to 1ADU/sec, and an average gain of 4.2.
The ratio of the scaled photons measured for a 0th magnitude star compared to the expected photons for Vega is then the throughput. and yields the following values (Z was not included in this initial analysis but has been factored in later). This does not yet include an analysis of any covariance in the detector noise properties, though earlier measurement on lab data suggested this was a much smaller effect than present in Rockwell Hawaii II devices. The WFCAM throughput is shown for comparison. The ETC columns uses all the latest data tables to directly compute the throughput ab-initio and compares favourably with the initial values deduced from the measured zeropoints.
| Filter | VISTA | WFCAM | ETC (CASU v1.5) |
|---|---|---|---|
| Z | 0.51 | 0.14 | 0.61 |
| Y | 0.45 | 0.17 | 0.52 |
| J | 0.53 | 0.21 | 0.55 |
| H | 0.66 | 0.28 | 0.67 |
| Ks | 0.63 | 0.27 | 0.61 |
Comparison with WFCAM
Our simple analysis suggests that VISTA is a factor 2.5 (at YJHK) to 3.5 (at Z) times more efficient than WFCAM. VISTA has a smaller collecting area though, by around 20%, which means the differences in zeropoints between the instruments is more like a factor 1.6 to 3 (0.5 mags at K, 1.2 mags at Z).
ETC limiting magnitude estimates
The ETC can also be used to estimate VISTA sensitivity figures for, say a range of total exposure times in 0.8 arcsec seeing using a 2 arcsec diameter aperture, with airmass 1.2 and extinction 0.05. Aperture corrections (0.35mag) to/from other data assuming a Moffat profile with beta=2.
| Filter | 5-sigma 5s | 60s | 900s | Sky brightness (mag/sq arcsec) |
|---|---|---|---|---|
| Z | 19.8 | 21.3 | 22.8 | 18.2 |
| Y | 19.2 | 20.6 | 22.1 | 17.2 |
| J | 18.8 | 20.2 | 21.7 | 16.0 |
| H | 17.9 | 19.3 | 20.7 | 14.1 |
| Ks | 16.9 | 18.3 | 19.7 | 13.0 |
Old values
Measured zeropoints in ADU and e- together with derived first-pass colour equations with respect to 2MASS from recent on-sky data. The average gain was taken as 4.2 (1.56 mag) - uncorrected for intrapixel capacitance.
| Filter | ZP (ADU) | ZP (e-) | Colour equation |
|---|---|---|---|
| Z | 23.95 | 25.51 | +0.950*(J-H) |
| Y | 23.50 | 25.06 | +0.550*(J-H) |
| J | 23.79 | 25.35 | - 0.070*(J-H) |
| H | 23.89 | 25.45 | +0.060*(J-H) |
| Ks | 23.06 | 24.62 | +0.020*(J-Ks) |
| NB118 | 20.92 | 22.48 | +0.100*(J-H) |