Spikes and Halos
VISTA images suffer from two types of artefacts produced by the telescope optics. Around bright, highly saturated objects both spike-like diffraction patterns, and ghost-like diffuse rings can be seen.
The spikes are symmetric around the bright stars, and rotate as the optics rotate with respect to the camera (alt-az telescope mount). Elsewhere we described the artificial sources that are produced by the diffraction spikes.
The ghosts are offset from the star in proportion to offaxis angle of the image. The ghost images arise from reflections between the filter and detector planes inside the camera housing.

Ghosts
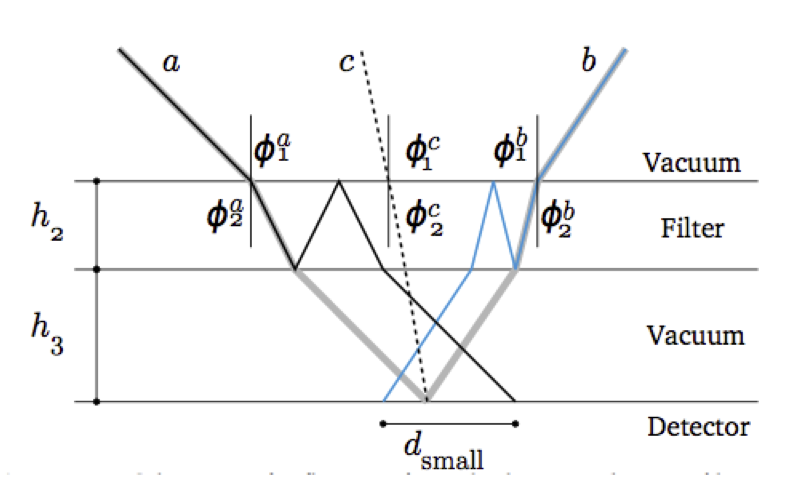
Figure 2. Ray path diagram showing the production of the small ghost images around bright sources in the VISTA images. Image reproduced from Findlay (2012).
There are three reflection paths corresponding to three different diameter ghost replicas. Depending on the brightness of the bright objects, the dominant ghost image size changes. The largest ghost images are only seen around the brightest stars, while only smaller size ghosts remain visible around somewhat fainter stars. Reproducing the empirical findings of Findlay, in Fig.3 (below) dashed horizontal lines mark the sizes and magnitude ranges of the dominant ghost images. The large ghosts dominates down to J< 6, the intermediate J< 7, and the smallest to J< 8. The figure also shows that ghost radii are usually slightly smaller than the empirical spike model radius at all magnitude values (see below). Bearing in mind that the displacement from the object center is small, the spike radius usually contains the ghost images. In other words, the exclusion of objects covered by ghosts does not increase number much compared to the spike exclusion areas. As the ghost patterns are produced entirely inside the camera hardware they always keep their relative location on the image and remain the same for a given field. This is a distinctive feature compared to the spikes that are not stationary.
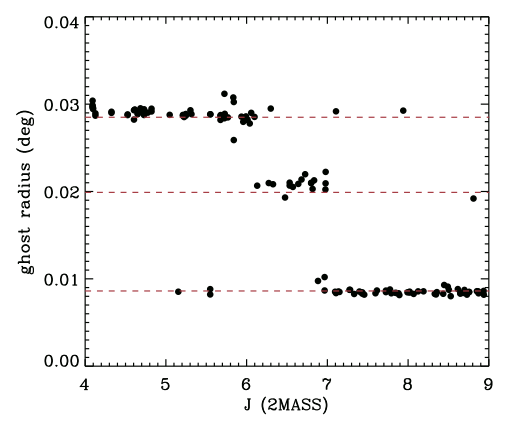
Figure 3. The extent of ghosts around bright stars. Points are measured direct from VIKING imaging frames, red dashed lines show theoretical predictions. The largest ghost appears until J2MASS <= 6 the intermediate J2MASS <= 7 and the small J2MASS<= 9. Theoretical predictions agree well with measured values but outliers are present due to the subjective nature of the measurements. The best approach in flagging sources around bright stars is to remain conservative, defining larger regions than perhaps is necessary. Figure from Findlay (thesis).
Spikes
In contrast to ghosts, spikes are a result of a more complex procedure that is not fully understood. They are caused by imperfections of the primary mirror. Because the diffraction originates in the optics before the camera, they are not stationary on the image as the camera rotates during exposure tracking to keep the image on the same pixels of the detector. Rotation of the camera is a common requirement on alt-azimuth telescope mounts. The figure below gives an idea of the extent that these spikes produce extra images measured by Joe Findlay.

Figure 4. Radii of regions around bright stars enclosing the majority of diffraction related artifacts. A few outliers are present from the main distribution but in general the scatter is small given the subjective nature of the measurements. The distribution is fit to a second order polynomial; r = 0.0004(J2MASS)2 −0.0096(J2MASS)+0.0671. By J = 12 diffraction ceases to be a problem around most bright stars.
Tests on Reproducibility of Photometry For Sources Near Bright Stars
In addition to spurious sources, diffraction spikes and artefacts which lie on top of real sources will perturb their photometry. We use time series photometry to attempt to asses at what radius from bright stars we can quantify the size of the effect. Repeat observations taken in Carina were analyzed (Kovacs, thesis, in prep). All sources had lightcurves constructed, and a robust RMS (root mean square deviation) measured from each lightcurve. For each bright star, we investigated the RMS of all nearby sources as a function of their separation from the bright star, and as a function of the bright star magnitude (and also the fainter star magnitudes). An example for all bright stars in the range J=5-6 is shown in the Figure below (Figure 5, for fainter stars in the magnitude range 15-16). We see that the median RMS of the fainter stars increases as they get closer to the bright star. The radius at which median curve of the RMS data crosses 1% and 2% is noted, and then used in the right hand figure. This figure plots the radius versus the magnitude of the bright stars: curves corresponding to the 1% RMS and 2% RMS are shown in green and red. We find that the 1% RMS curve agrees quite well with the empirical radius derived by Findlay (above).
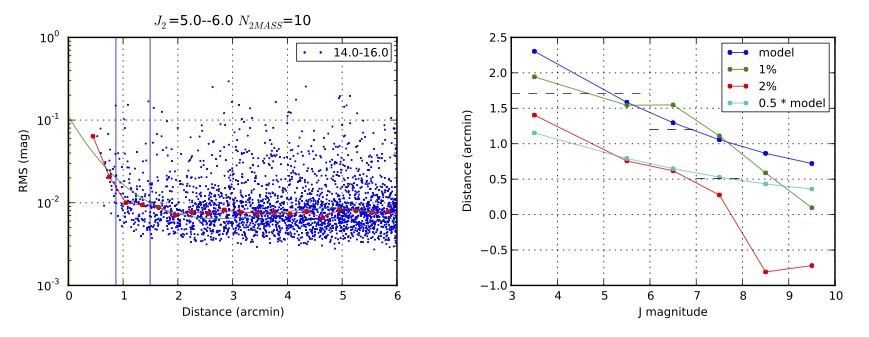
Figure 5: Left: Aggregated rms plot of photometrically good objects. VISTA objects with good photometric quality indicators are plotted as a function of their distance from bright sources in J2 = 5– 6 range. Right: Comparison with Findlay (2012) model radius. The 1 and 0.5 model radii (blue,cyan) are shown along with our 1% and 2% median RMS solutions (green,red). The dashed line shows the dominant ghost radii in their corresponding magnitude range (<6, 6–7, 7–8).