Stacking Analysis
A set of pawprints on the same pointing have been used in order to study the properties of stacks generated from them. Images have been obtained in J band during the nights 20090522 to 20090527 inclusive. All the nights are mostly photometric; the following links show the photometric zero points for each night (blue on those plots is J band):
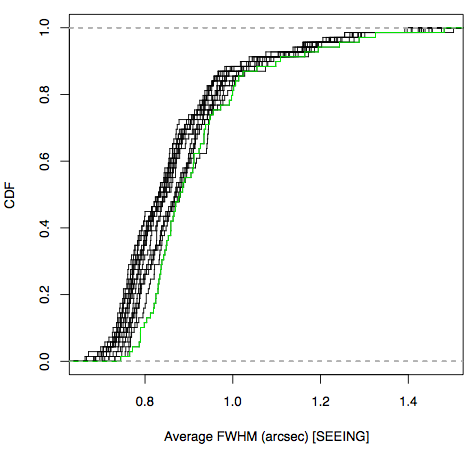
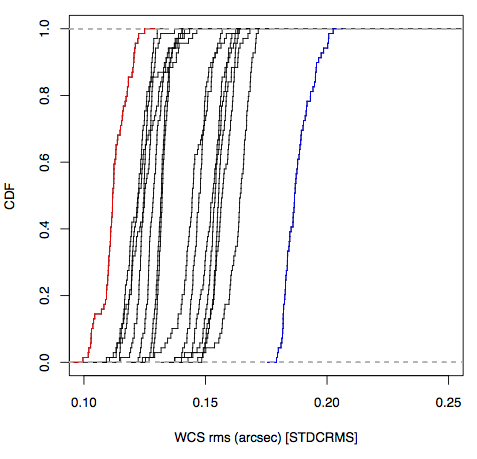
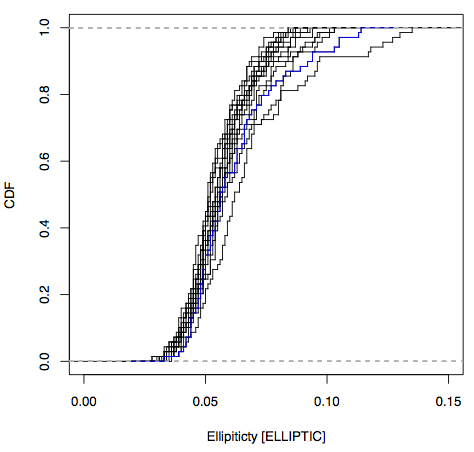
The following plots show the distribution (cumulative) of average FWHM, WCS rms and Ellipticity per chip for all the pawprint images. The extreme cases are higlighted in colour: green is chip 16 which shows the worst average seeing overall, blue is chip 8 which shows the worst WCS rms fit and red is chip 5.
Stacks are first created from the standard processed pipelined images using n random selected files where n=1,4,9,16,25,36,49,64 (there are 69 files in total). The standard image detection software is then run in each of the stacks in order to obtain the sky noise. The following figure shows the sky noise as a function of the number of images in each stack.

Another test involves background subtracting the pawprint images using an iterative clipping median filter box of 201 pixels wide and a linear filter of 51 pixels before creating the stacks. Those are also background filtered before running the image detection software and computing the sky noise. Results are similar implying that prior background substraction is not necessary for good quality stacks.
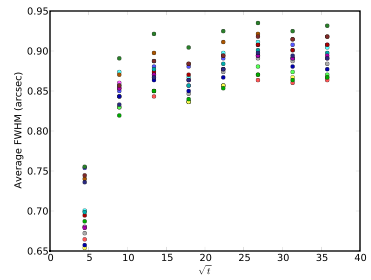
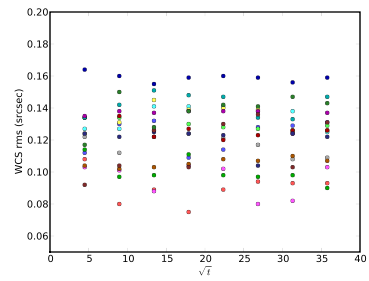
The following plots how the WCS rms and the average FWHM varies with the number of stacked images. Chip 16 is the one with the worst average FWHM systematically (left plot) while chip 8 is the one with worst WCS rms (right plot). Note that the stacking is using nearest neighbour interpolation which gives uncorrelated noise and produces as an effect the slight increase in average seeing that we are seeing. Drizzling is an alternative which would improve this, keeping the average seeing to about 0.8 arcsec but producing correlated noise.
 |  |
Fluxes of point-like objects measured in the different stacks are also analysed. The following plots show the flux measured in the deeper stack compared to the flux in the other stacks (so first set of points is mag(stack64)-mag(stack01), then mag(stack64)-mag(stack04, and so on). Left is using the default aperture corrected flux in a 1 arcsec radius. Right is in 2 arcsec radius. Note that the photometric calibration has not been rerun on the stacks, so small offsets are expected.
 |  |
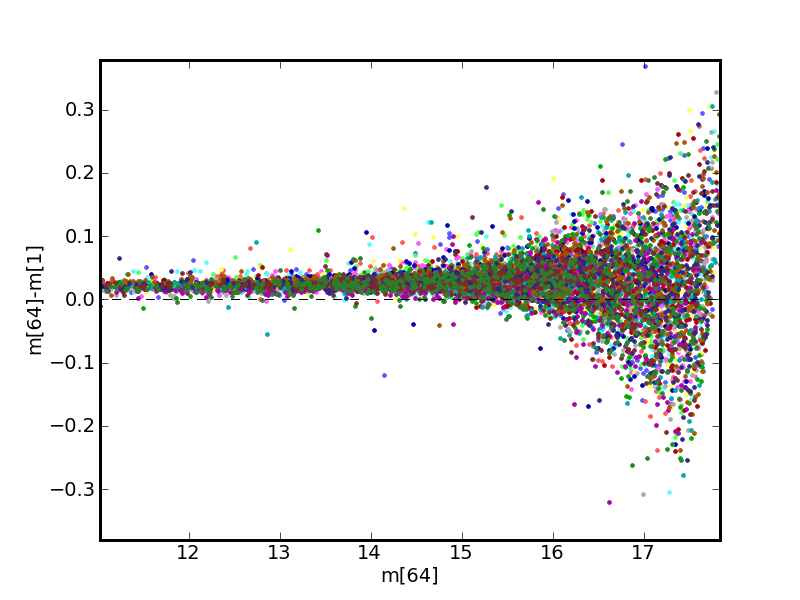
The following plot shows the difference between the magnitudes between objects detected in the stack 64 and an individual pawprint image -- only point-like classified objects shown, aperture of 1 arcsec used:
The following images show a region of chip 1 in each of the stacks. From top to bottom and left to right, stack number 4, 9, 16, 25, 49 and 64 (click on the images for a larger view).
 |  |
 |  |
 |  |

