Flatfield

WFCAM flatfielding departs somewhat from the usual NIR processing strategies by making extensive use of twilight flats, rather than dark-sky flats, which potentially can be corrupted by thermal glow, fringing, large objects etc. The principle adopted is to attempt to decouple, insofar as is possible, sky estimation/correction from the science images.
Ideally, sufficient (dawn) twilight flatfield frames to form master flats are taken once per week using a series of 9-point jitter sequence observations in Z,J,K one night and Y,H the next. Note that it is impossible to get good flats in all broadband filters in any one night. The suitable individual 9-point jitter sequences (~5000-20000 counts/pixel ie. ~25000-100000 e-/pixel) are dark-corrected and then scaled and robustly combined to form new master flats. If enough are available, these may be further combined to reduce the random photon error in the master flats even further. If available a pair of these flats at different count levels (~factor 2) is then used to automatically locate the bad pixels and create the generic confidence map, one for each filter. Bad pixels are defined as those having properties significantly different from their local neighbourhood "average" in the individual master flats or in their ratio.
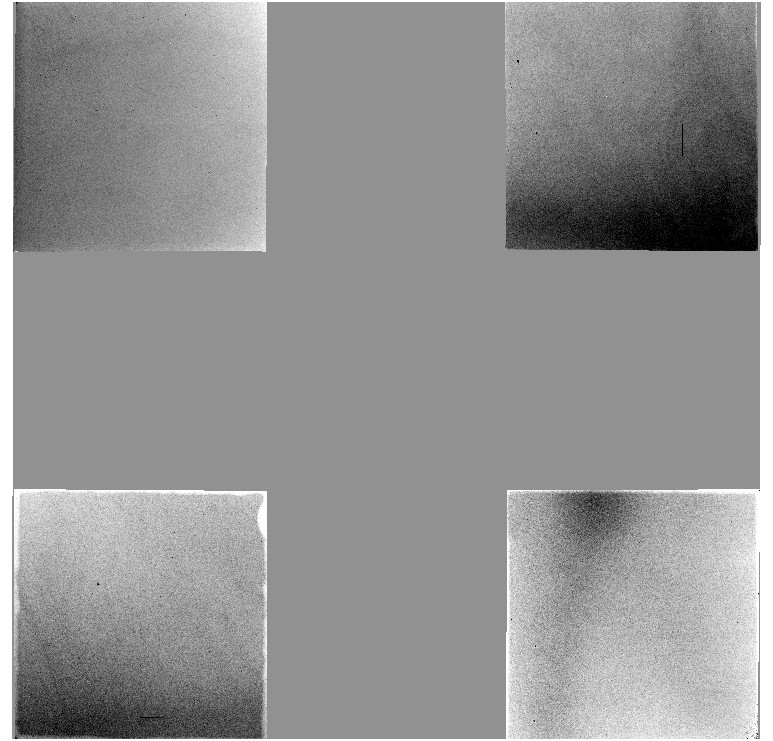
These flats give good dark sky correction (ie. gradients are at the ~1% level at most), and show no fringing nor measureable thermal emission. The overall QE is good but the flats show large spatial gradients across the detectors indicative of up to a factor of 2 sensitivity variation. Since the general characteristics of these variations can be seen across all filters, the simplest interpretation is that these variations in level reflect genuine sensitivity variations across the detectors. This has been subsequently confirmed by examining the chi squared values of the residuals from PSF-fitting. These sensitivity variations also cause problems for the generation of the confidence maps, uniformity of surveys, and possibly also impacts on the calibration error budget.
The example flatfield shown is derived from all 4 detector H-band master flats for the period 7th-19th April 2005 shown in mosaic overview (N to top E to left).
Confidence Maps
We define a confidence map as a normalised (to a median level of 100%) inverse variance weight map denoting the “confidence” associated with the flux value in each pixel. This has the advantage that the same map can also be used to encode for hot pixels, bad pixels or dead pixels, by assigning zero confidence. Furthermore, after image stacking the confidence map also encodes the effective relative exposure time for each pixel, thereby preserving all the relevant intra-pixel information for further optimal weighting. The initial confidence map for each frame is derived from regular analysis of the master calibration flatfield and dark frames and is unique for each filter/detector combination due to the normalisation. To use the confidence maps for weighted coaddition of frames then simply requires an overall estimate of the average noise properties of the frame. This can readily be derived from the measured sky noise, in the Poisson noise-limited case, or from a combination of this and the known system characteristics (e.g. gain, readout noise).
All processed frames (stacked individual detectors, tiled mosaicked regions) have an associated derived confidence map which is propagated through the processing chain.

